所谓函数:
指的是变量与自变量的关系
其中,变量是随着自变量的变化而变化的,自变量决定变量
例如,y=2x2+1
当x取值1,2,3,4 时,y都有一个对应的值。
y就是变量,x就是自变量。
我们称 y是x的函数。
y=sinθ的图象
我们令r=1,则无论θ的终边在什么位置上, sinθ=y/1=y。
也就是,θ终边上的点纵坐标y就是sinθ的数值。

如图7-1-1所示,在平面坐标内,以原点为圆心,半径为1的圆称为单位圆。
如图7-1-3,把y坐标横向移到右图中,再在其对应的θ位置上标出度数就可以看到sinθ的图象,它是一个曲线。
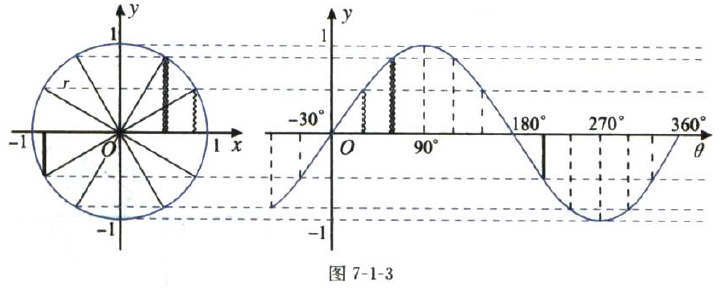
这个图象中,在90°和270°两个地方,曲线几乎成水平形状(下面用matlab画的图中也存在这种现象),目前无法用所学的知识解释这个现象,但是如果用”微分法“就能说明清楚。
正弦函数的图象,最大的特点是其周期性,而y=sinθ的周期就是360°
有周期的函数我们就称为周期函数,而周期性是三角函数的最大特点。
像行星运动轨迹、钟摆、弹簧、描述声音、光及电磁波、数学式子表示交流电,这些都需用到三角函数。
勇哥用Matlab画y=sinθ,如下:
x=[-30:0.1:360]
y=sin(degtorad(x))
plot(x,y)

令r=1的这种画法,只适合手工绘图,如果用C#或者halcon画,勇哥不知道怎么搞。
如果非要用C#来画,确实非常的不直观。
下面的程序先生成九组点,然后连接九个点画曲线的方式来模拟人工绘图的方法。
private void button10_Click(object sender, EventArgs e)
        {
            int x = 200, y = 150;
            Graphics g = this.pictureBox1.CreateGraphics();
            Pen p = new Pen(Color.Black);
            p.EndCap = LineCap.ArrowAnchor;
            g.DrawLine(p, new Point(x, this.Height - x), new Point(this.Width - x, this.Height - x));

            g.DrawString("x", this.Font, new SolidBrush(Color.Black), new Point(this.Width - x + 5, this.Height - x));
            p.EndCap = LineCap.ArrowAnchor;
            g.DrawLine(p, new Point(y, this.Height - 50), new Point(y, x));
            g.DrawString("y", this.Font, new SolidBrush(Color.Black), new Point(y, x - 10));
            Point[] point = new Point[9];
            int h = 50, w = (Width - 250 - 50) / 8;
            for (int i = 0; i < 9; i++)
            {
                point[i] = new Point(y + i * w, this.Height - x - Convert.ToInt32(h * Math.Sin(2 * Math.PI / 360 * 90 * i)));
                drawPt(point[i].X,point[i].Y,10);
            }

            g.DrawCurve(p, point, 0.4f);


        }
下面的程序完全使用画线的方式来工作。
private void button11_Click(object sender, EventArgs e)
        {
            DrawSin(this.pictureBox1.CreateGraphics());
        }

        private void DrawSin(Graphics g)
        {
            Pen p = new Pen(Color.Black, 1);
            int Zoom = 10;  //放大倍数
            Point center = new Point(100, 100); //原点

            float x1 = (float)(0 * Math.PI * Zoom / 180 + center.X);
            float y1 = (float)(Math.Sin(0 * Math.PI / 180) * Zoom + center.Y);

            g.DrawLine(p, 0, center.Y, 1000, center.Y);  //x坐标轴
            g.DrawLine(p, center.X, 0, center.X, 1000);  //y坐标轴

            for (int i = 1; i < 360 * 5; i++)   //角
            {
                float x2 = (float)(i * Math.PI * Zoom / 180 + center.X);
                float y2 = (float)Math.Sin(i * Math.PI / 180) * (-1) * Zoom + center.Y;


                g.DrawLine(p, x1, y1, x2, y2);

                x1 = x2;
                y1 = y2;

            }
        }
还是matlab画图简单又能表达数学概念,但是隐藏了绘图的细节,而我们学习三角函数是为了熟悉图形学基础,我们研究的就是绘图用到的细节,所以matlab画的图仅供参考。
---------------------
作者:hackpig
来源:www.skcircle.com
版权声明:本文为博主原创文章,转载请附上博文链接!